Welcome to! Metamass

Human/Animal
HOME > Platforms > Human/Animal
In vivo metabolomics (Skin/Liver/Plasma)
UVB조사에 의해 변화하는 간 내 대사체 biomarker 검출
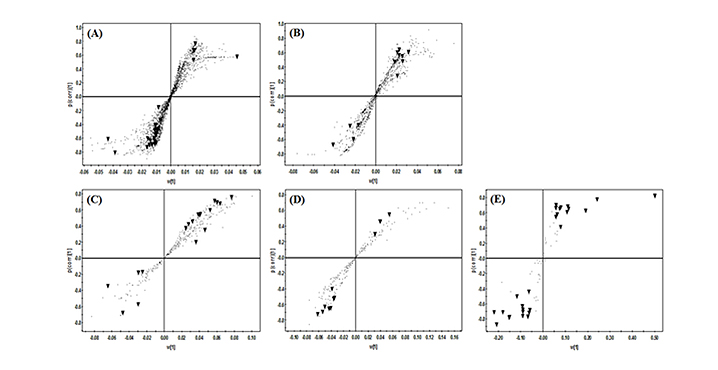
- igure 2. S-plots associated with OPLS-DA score plots derived from GC-TOF-MS (A, B), UPLC-Q-TOF-MS (C, D) and nanomate LTQ-MS (E) data sets for MW (A, C), DM (B, D) and lipid (E) extracts of mouse liver tissue after the exposure to UVB radiation for 6 weeks. The selected Variables (▼, VIP>0.7 and p<0.05) are highlighted in S-plots. Each metabolites Presented by a inverted triangle (▼) were the same metabolites presented in
Tablese 3-5.
doi:10.1371/journal.pone.0109479.g002
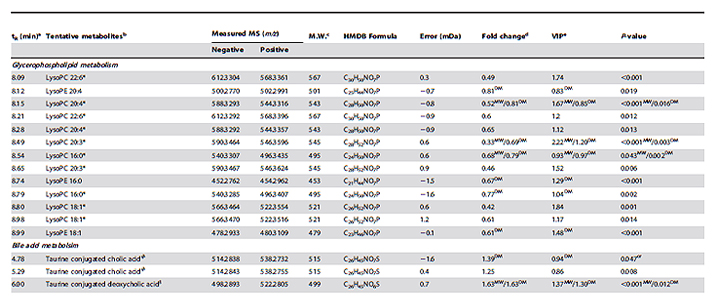
- Table 4. Metabolites in MW and DM extracts from the mouse liver that were significantly different between the normal and UVB groups after 6 weeks and were tentatively identified using UPLC-Q-TOF-MS analysis.
Mass Spectrometry-Based Metabolite Profiling in the Mouse Liver following Exposure to Ultraviolet B Radiation,
Park HM and Lee CH et al., Plos one 2014, 9(10), e109479.
Urine과 Serum분석을 통한 카페인 섭취의 항비만 효과와 biomarker 검출
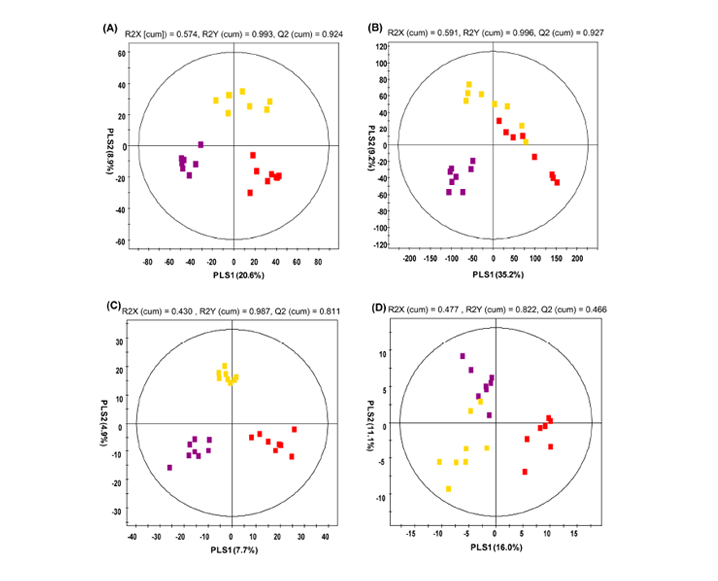
- Figure 1. Partial least-squares discriminant analysis (PLS-DA) score plots. Urine analysis by (A) UPLC-Q-TOF-MS and (B) GC-TOF-MS. Serum analysis by (C) UPLC-Q-TOF-MS and (D) LTQ-XL-MS. (■: normal diet; ■: high-fat diet, ■: high fat diet with caffeine).
Urine and Serum Metabolite Profiling of Rats Fed a High-Fat Diet and the Anti-Obesity Effects of Caffeine Consumption ,
Kim HY and Lee CH et al., Molecules 2015, 20, 3107-3128; doi:10.3390/molecules20023107
녹차 섭취가 광노화 피부 대사체에 미치는 영향에 관한 연구
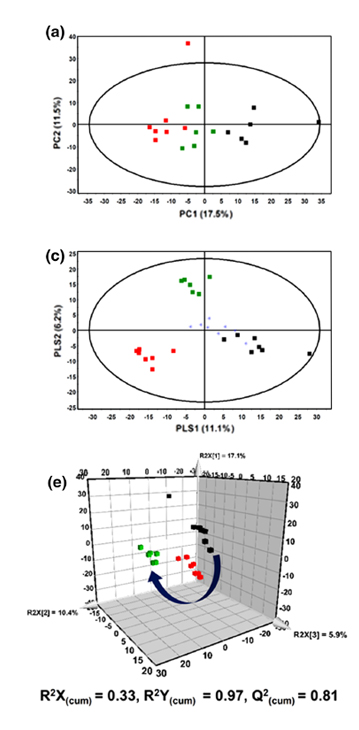
- Fig. 2 The PCA score scatter plots (a), (b) and PLS-DA score scatter plots (c), (d), (e), (f) of mouse skin tissue extracts analyzed by UPLCQ-TOF-MS (a), (c), (e) and GC-TOF-MS (b), (d), (f). c, d?QC
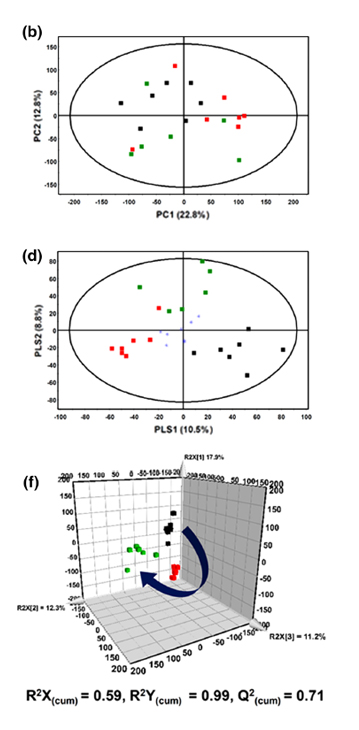
- samples-containing PLS-DA score plot; e, f?Three-dimensional PLS-DA score plot. Black Filled square?NOR group; Red filled square?UVB group; Green filled square?UVB + CGT group
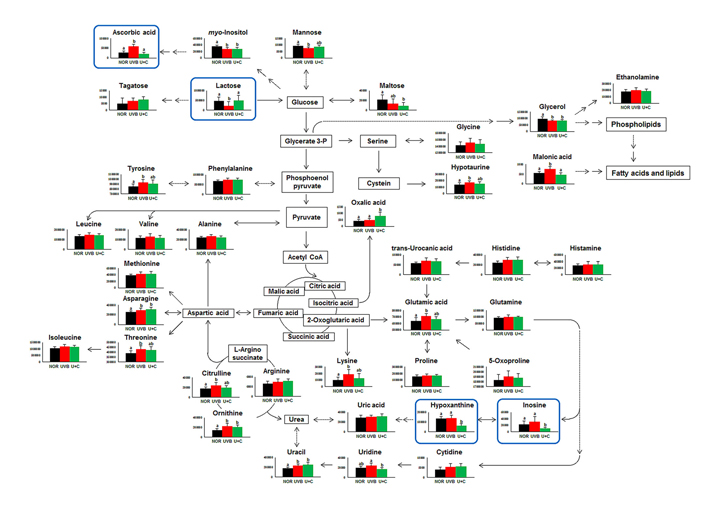
- Fig. 3 A schematic diagram of the proposed metabolic pathway based on the changes of mouse skin metabolites caused by UVB rradiation and its attenuations according to CGT administration. The different letters indicate significant differences as determined by ANOVA followed by Duncan’s multiple range tests (p�.05). The dashed line indicates multiple steps. Black Filled square?NOR group; Red filled square?UVB group; Green filled square?UVB + CGT group. Blue square boxes indicate biomarker candidates to explain CGT effects on UVB-irradiated skin 870 E. S. Jung et al.123
A metabolomics approach shows that catechin-enriched green tea attenuates ultraviolet B-induced skin metabolite alterations in mice, Jung ES and Lee CH et al., Metabolomics (2015) 11:861?871, DOI 10.1007/s11306-014-0743-x