Welcome to! Metamass
Microorganism
HOME > Platforms > Microorganism
대사체 기법을 이용한 Penicillium 속의 chemotaxonomy
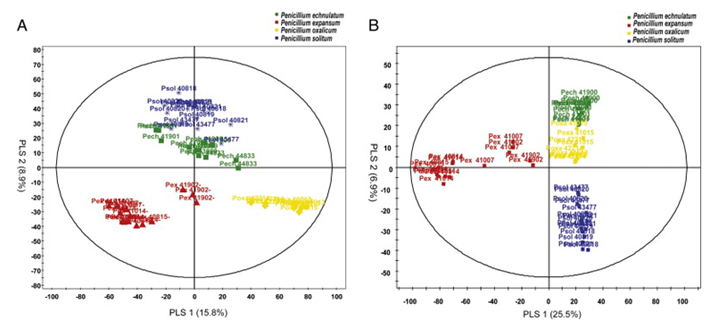
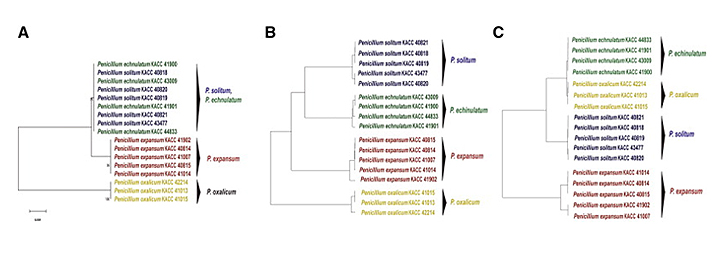
- Mass spectrometry?based chemotaxonomic classification of Penicillium species (P. echinulatum, P. expansum, P. solitum, and P. oxalicum) and its correlation with antioxidant activity, Kim HY and Lee CH et al., Journal of Microbiological Methods 90 (2012) 327?335
- Fig. 1. Partial least-squares discriminant analysis (PLS-DA) score plots derived from the LC-ESI-MS (A) and GC-IT-MS (B) datasets of Penicillium spp. Red, P. expansum; green, P. echinulatum; yellow, P. oxalicum; blue, P. solitum.
Mass spectrometry?based chemotaxonomic classification of Penicillium species (P. echinulatum, P. expansum, P. solitum, and P. oxalicum) and its correlation with antioxidant activity, Kim HY and Lee CH et al., Journal of Microbiological Methods 90 (2012) 327?335
Penicillium expansum의 solid state fermentation 동안의 대사체와 전사체의 변화에 관한 연계 해석
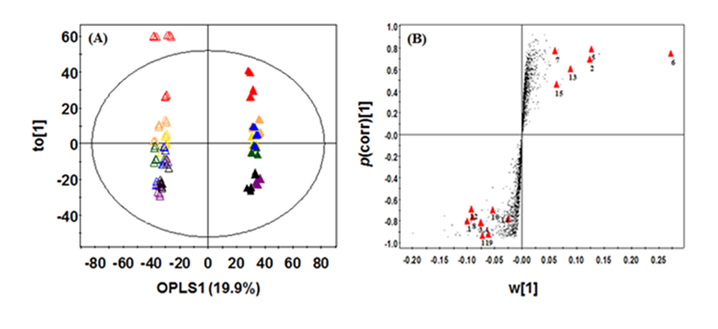
- Figure 1. Principal component analysis (PCA) score plot derived from the UPLC-Q-TOF-MS dataset of P. expansum 40815 during fermentation. (△: Submerged fermentation, ▲: Solid-state fermentation, ●: 0 days, ●: 4 days, ●: 6 days, ●: 8 days, ●: 10 days, ●: 12 days, ●: 14 days, ●: 16 days)
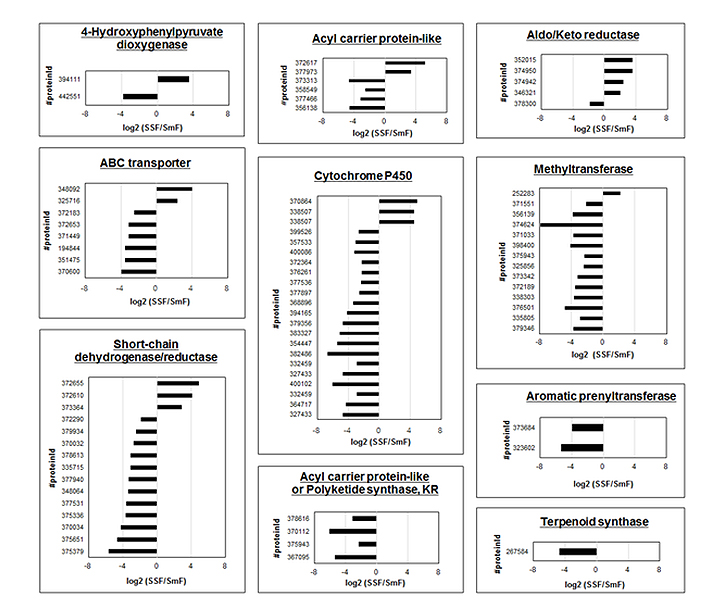
- Figure 5. Transcript abundance values of DEGs in secondary metabolism. Abundance values (log2 SSF/SmF) and transcripts with significant variations (log2 SSF/SmF bundance greater than 1) are shown.
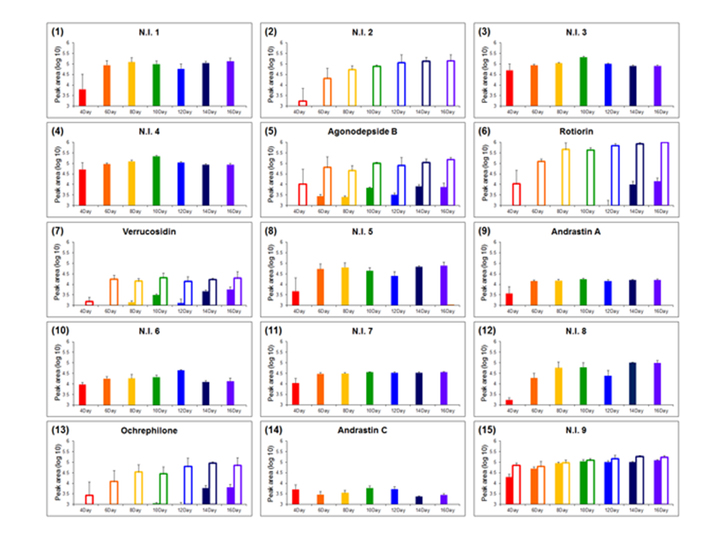
- Figure 3. Production profiles of variant metabolites from solid-state and submerged fermentation of P. expansum 40815. The Y-axis of graphs indicates the UPLC-Q-TOF-MS data transformed by log10. (△: Submerged fermentation, ▲: Solid-state fermentation; ●: 4 days, ●: 6 days, ●: 8 days, ●: 10days, ●: 12 days, ●: 14 days, ●: 16 days)
Metabolomic and Transcriptomic Comparison of Solid-State and Submerged Fermentation of Penicillium expansum KACC 40815, Kim HY and Lee CH et al., Plos one 2016

