Welcome to! Metamass
Plant
HOME > Platforms > Plant
식물 대사체학 : 식물 세포 및 조직에 존재하는 모든 대사산물의 시간적, 공간적 변화를 추적 조사함으로써 식물의 복잡 한 생리 현상을
총체적으로 이해하는 연구 분야

연구방향예시
- 대사체 프로파일링을 통한 정성/정량 가능
- 다변량 통계분석을 통한 도식화 가능
- STATISTICA, MEV, Heat map, correlation map 등을 통한 도식화 가능
시기별 고추에서의 대사체 전사체 연계 해석
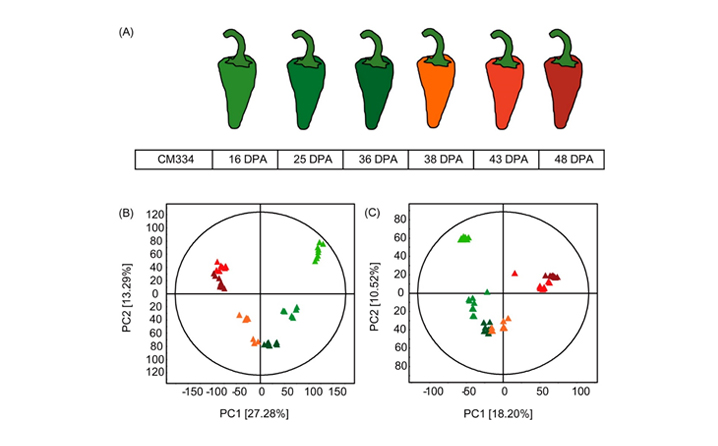
- Figure 1. (A) Experimental design of hot pepper CM334 (C. annuum) harvested at six development stages. PCA score plots derived from non-targeted metabolite profiling of hot peppers analyzed by (B) GC?TOF?MS and (C) UHPLC?LTQ?ESI?IT?MS/MS [immature green triangles, 16 DPA; green triangles, 25 DPA; mature green triangles, 36 DPA; orange triangles, 38 DPA (Br); red triangles, 43 DPA; and dark red triangles, 48 DPA].
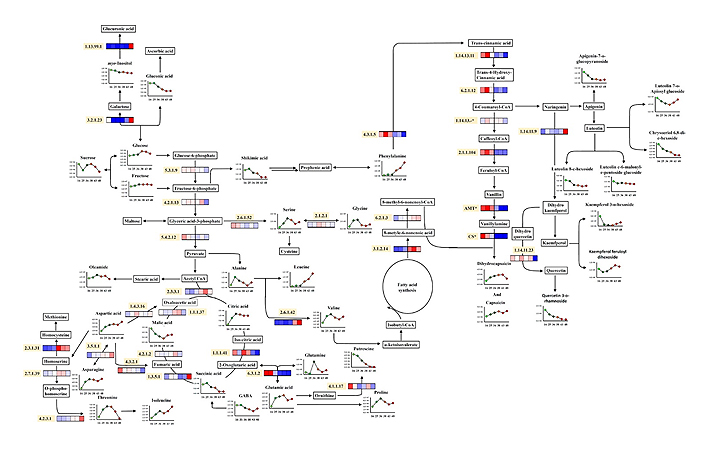
- Figure 3. Proposed biosynthetic pathway and relative metabolite contents and gene expressions in six development stages of hot peppers (16, 25, 36, 38, 43, and 48 DPA). The pathway was modified from the KEGG database (http://www.genome.jp/kegg/). EC numbers for the mentioned enzymes are as follows: 1.13.99.1 (myo-inositol oxygenase), 3.2.1.23 (β-galactosidase), 5.3.1.9 (glucose-6-phosphate isomerase), 4.2.1.13 (fructose-bisphosphate aldolase), 5.4.2.12 (phosphoglycerate mutase), 2.6.1.52 (phosphoserine aminotransferase), 2.1.2.1 (serine hydroxymethyltransferase), 2.3.3.1 (citrate synthase), 1.1.1.37 (malate dehydrogenase), 4.2.1.2 (fumarase), 1.3.5.1 (succinate dehydrogenase), 1.1.1.41 (isocitrate dehydrogenase [NADP]), 3.5.1.1 (l-asparaginase), 4.3.2.1 (argininosuccinate lyase), 1.4.3.16 (l-aspartate oxidase), 2.3.1.31 (serine acetyltransferase 7), 2.7.1.39 (homoserine kinase), 4.2.3.1 (threonine synthase), 6.3.1.2 (glutamine synthetase), 2.6.1.42 (branched-chain amino acid aminotransferase), 4.3.1.5 (PAL), 1.14.13.11 (cinnamic acid 4-hydroxylase), 6.2.1.12 (4-coumarate:coenzyme A ligase), 1.14.13 (putative p-coumarate 3-hydroxylase), 2.1.1.104 (putative caffeoyl-CoA 3-O-methyltransferase), 1.14.11.9 (flavanone 3-hydroxylase), 1.14.11.23 (flavonol synthase/flavanone 3-hydroxylase), 6.2.1.3 (putative long-chain acyl-CoA synthetase), 3.1.2.14 (acyl-ACP thioesterase), AMT* (putative aminotransferase), and CS* (acyltransferase).
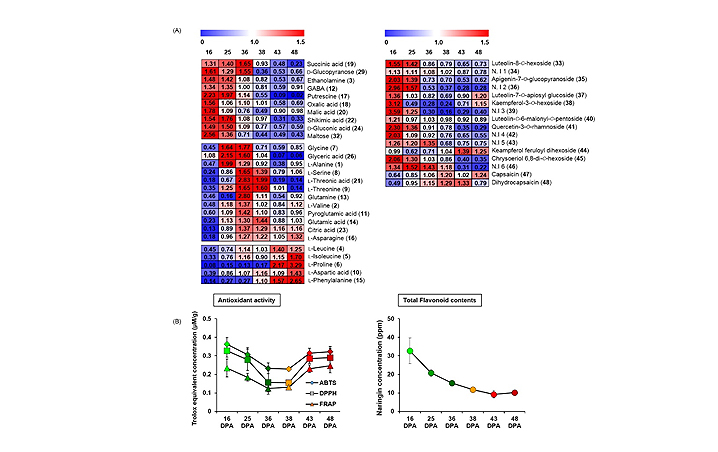
- Figure 2. (A) Heat map of significantly changed (left) primary and (right) secondary metabolites analyzed by GC?TOF?MS and UHPLC?LTQ?ESI?IT?MS/MS, respectively, and (B) antioxidant activity tests of ABTS (diamonds), DPPH (squares), and FRAP (triangles) and TFCs (circles) during hot pepper development stages (16, 25, 36, 38, 43, and 48 DPA). Values represent fold changes normalized by an average of all values.
Metabolomic Characterization of Hot Pepper (Capsicum annuum “CM334”) during Fruit Development, Jang YK and Lee CH et al., J. Agric. Food Chem. 2015, 63, 9452?9460, DOI: 10.1021/acs.jafc.5b03873
품종 별 쌀 종자의 대사체적 차이 해석
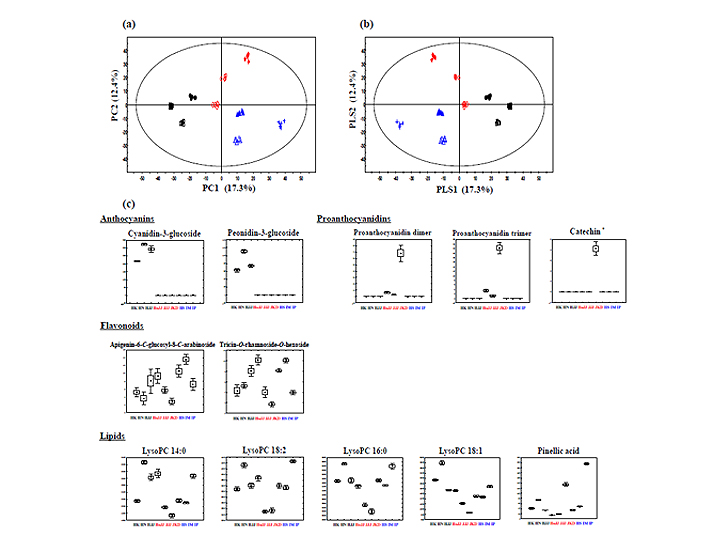
- Figure 1. The principal component analysis (PCA) score plots (a), partial least-square discriminant analysis (PLS-DA) score plots (b), and box-whisker plots (c) of nine different varieties of rice seeds analyzed by UPLC-Q-TOF-MS. Black rice seed: ● HK (Heugkwang), □ HN (Heugnam), ■ HJJ (Heugjinju); Red rice seed: ◇ HoJJ (Hongjinju), ○ JJJ (Jeogjinju), ж JKD (Jakwangdo); White rice seed: ▲ HS (Hwaseong), + IM (Ilmi), △ IP (Ilpoom)
* Target identified.
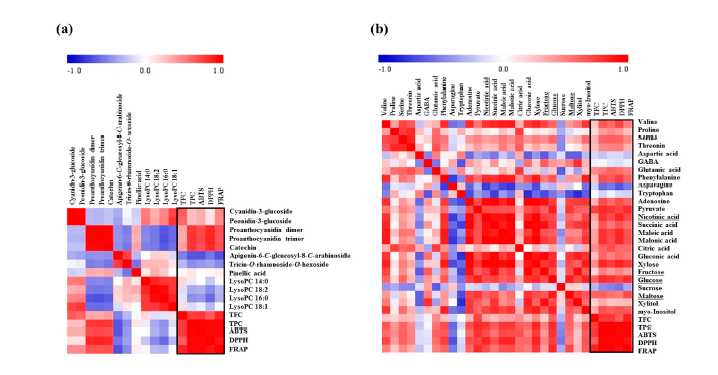
- Figure 4. Correlation map of metabolites analyzed by UPLC-Q-TOF-MS and antioxidant activities (a) and correlation map of metabolites analyzed by GC-TOF-MS and antioxidant activities (b). Each square indicates r (Pearson’s correlation coefficient values for a pair of metabolites or antioxidant activities). The red color represents positive (0 < r < 1) correlation and blue color represents negative (?1 < r < 0) correlation.
Combined Mass Spectrometry-Based Metabolite Profiling of Different Pigmented Rice (Oryza sativa L.) Seeds and Correlation with Antioxidant Activities, Kim GR and Lee CH et al., Molecules 2014, 19, 15673-15686; doi:10.3390/molecules191015673
시기별 싸리에서의 계절에 따른 대사체 변화와 미백과 항산화 활성의 연계 해석
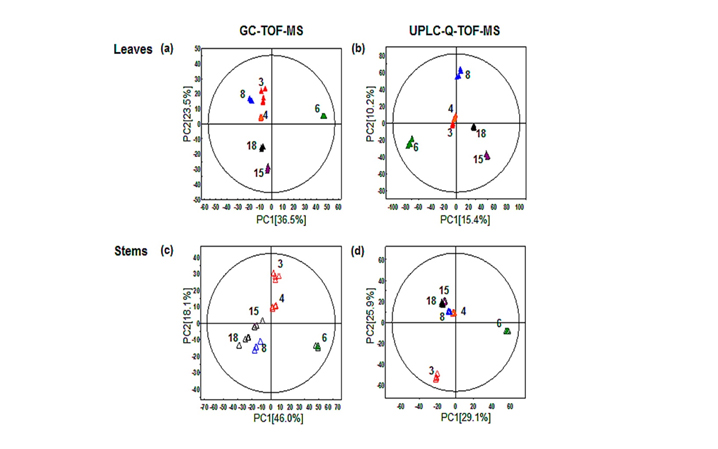
- Figure 1. Principal component analysis (PCA) score plots of leaves (a and b) and stems (c and d) collected during different growth periods of L. maximowiczii and analyzed by GC-TOF-MS (a and c) and UPLC-Q-TOF-MS (b and d). Each symbol represents a growth period after germination, in either the leaves or stems of L. maximowiczii (filled triangles, leaves; empty triangles, stems): red for 3 months (harvest date, June 2013), orange for 4 months (July 2013), green for 6 months (September 2013), blue for 8 months (November 2013), purple for 15 months (June 2014), and black for 18 months (September 2014). PLS-DA models were fitted using the following quality parameters. (a) R2X(cum) = 0.941; R2Y(cum) = 0.992; Q2(cum) = 0.989. (b) R2X(cum) = 0.425; R2Y(cum) = 0.992; Q2(cum) = 0.843. (c) R2X(cum) = 0.935; R2Y(cum) = 0.997; Q2(cum) = 0.991. (d) R2X(cum) = 0.835; R2Y(cum) = 0.994; Q2(cum) = 0.999. The p values were below 0.05 in all analyses.
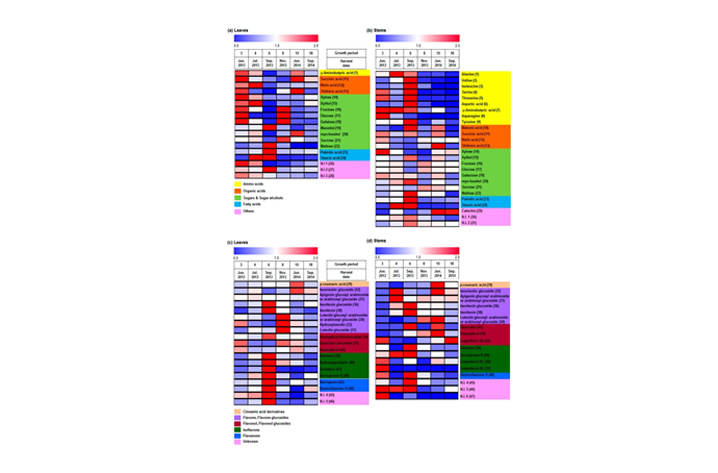
- Figure 2. Heat maps of different metabolites from the leaves (a and c) and stems (b and d) of L. maximowiczii during different growth periods, from GC-TOF-MS (a and b) and UPLC-Q-TOF-MS (c and d) analysis. Growth periods after germination are shown in each column, with colors representing relative abundance, and relative intensities indicated by the heat scale. The numbering of metabolites is identical to that in Tables S1 and S2.
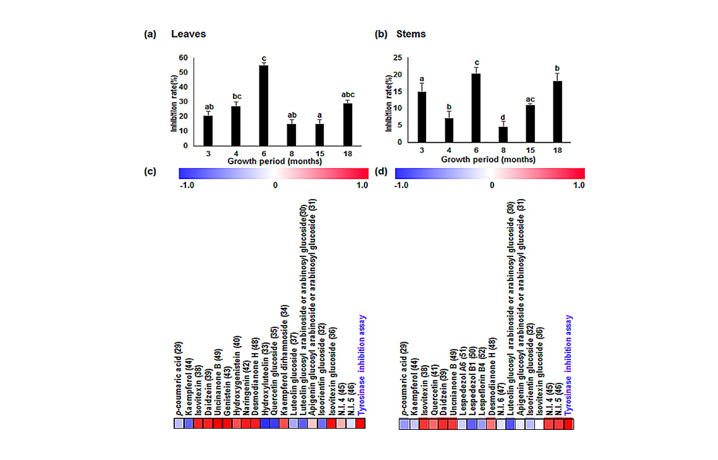
- Figure 3. Tyrosinase inhibitory activity in (a) leaves and (b) stems of L. maximowiczii during different growth periods, and a correlation map of metabolites and tyrosinase inhibitory activity in the (c) leaves and (d) stems of L. maximowiczii. Data were evaluated using a one-way ANOVA followed by Duncan’s multiple-range test. Means with different letters, e.g., “a” or “b”, are statistically different. Differences were considered significant at p values of <0.05. All assays were conducted in triplicate. Each square (c and d) indicates the r (Pearson’s correlation coefficient values) for a pair of averaged values from either metabolites or tyrosinase inhibitory activity. Red represents positive (0 < r < 1) correlations, and blue represents negative (?1 < r < 0) correlations.
Seasonal Variations of Metabolome and Tyrosinase Inhibitory Activity of Lespedeza maximowiczii during Growth Periods, Kim NK and Lee CH et al., J. Agric. Food Chem. 2015, 63, 8631?8639, DOI: 10.1021/acs.jafc.5b03566

